 My Account
 6 Best Free Data Visualization WordPress Plugins In 2024
Data is often the protagonist of the digital narrative we spin online, but it often needs to be understood in translation. Humans are more adept at processing visual data than reading reports or spreadsheets riddled with complex patterns. As a result, WordPress bloggers and business site owners can now use data visualization charts and graphs to make their content more engaging. With the right Data Visualization WordPress Plugins, your site can be transformed into an artist that paints insights with various data visual elements.
Furthermore, data visualization simplifies the understanding of the data being shared. Several WordPress plugins and tools are available to create graphs, charts, and infographics, depending on one’s objectives. Therefore, in this post, we bring you the collection of the best free data visualization WordPress plugins that you can try on your site.
List Of Best Free Data Visualization WordPress Plugins
1. Visualizer
2. Ninja Tables
3. Analytify
4. Graphina
5. Ninja Charts
6. AI Infographic Maker
Also, Read:
Best Free WordPress Dropdown Menu Plugins
Best Free Anti-Spam WordPress Plugins
1. Visualizer
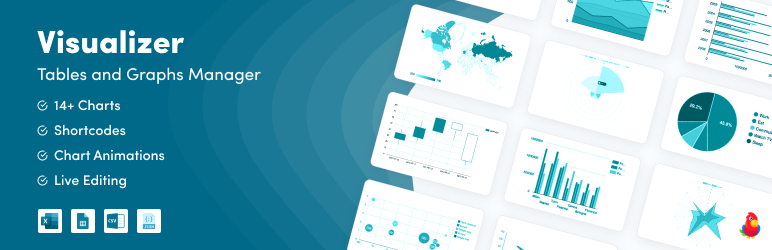
Visualizer is a responsive, powerful plugin for creating visually appealing and interactive charts and tables that you embed into your WP posts and pages. The plugin also lets you manage and embed animated charts, graphs, and tables through Google Visualization API, ChartJS, and DataTables.net. All the embedded elements are cross-browser compatible and work perfectly on all devices. Furthermore, you can customize the charts and tables down to a single column with its customization features. Also, the Visualizer plugin allows you to import the data from Excel, Google Sheets, CSV, and other sources. Besides this, the plugin gives you options to add pagination, search, sorting capabilities, and more to your charts, graphs, and tables. In addition, all the added animated data charts and graphs are rendered using HTML5/SVG technology.
2. Ninja Tables

Ninja Tables is another excellent tool for visualizing your data through stunning tables. This plugin lets you build and customize various types of WP tables from scratch without writing codes. Furthermore, the plugin gives you amazing features like a drag-and-drop table builder, table design customization, charts, Fluent Forms integration, stackable tables, buttons/ratings, cell split/merge, and more. Also, Ninja Tables has pre-made templates, and you can even import or export your data with ease using the Ninja Tables plugin. To know more about its features, you can check out the plugin demo. Ninja Tables is an excellent table data visualization tool that you can use for your WP dashboard.
3. Analytify
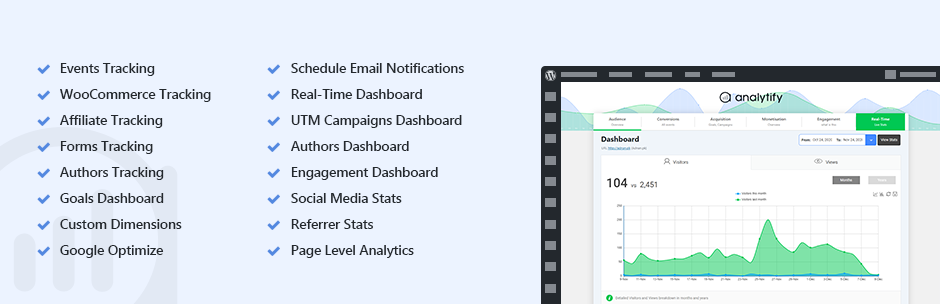
The Google Analytics Dashboard Plugin is an open-source tool designed to simplify Google Analytics for WP users using appealing and engaging data visualization features. The plugin provides a platform to monitor website analytics, a crucial aspect of website management. It offers statistics such as visitors, new vs. returning visitors, page views, and other relevant metrics. One of Analytify’s remarkable features is that it allows page-level statistics viewing, including metrics such as views, bounce rate, average on-page user time, etc. The geographical data visualization presents a list of all countries and cities generating traffic to the website. Hovering the mouse over the map highlights the top traffic countries. Furthermore, Real-time reporting is available on WordPress dashboards by connecting the site with Analytify. Its frontend tracking reports shortcode provides easy access to tracking reports on WordPress dashboards.
4. Graphina
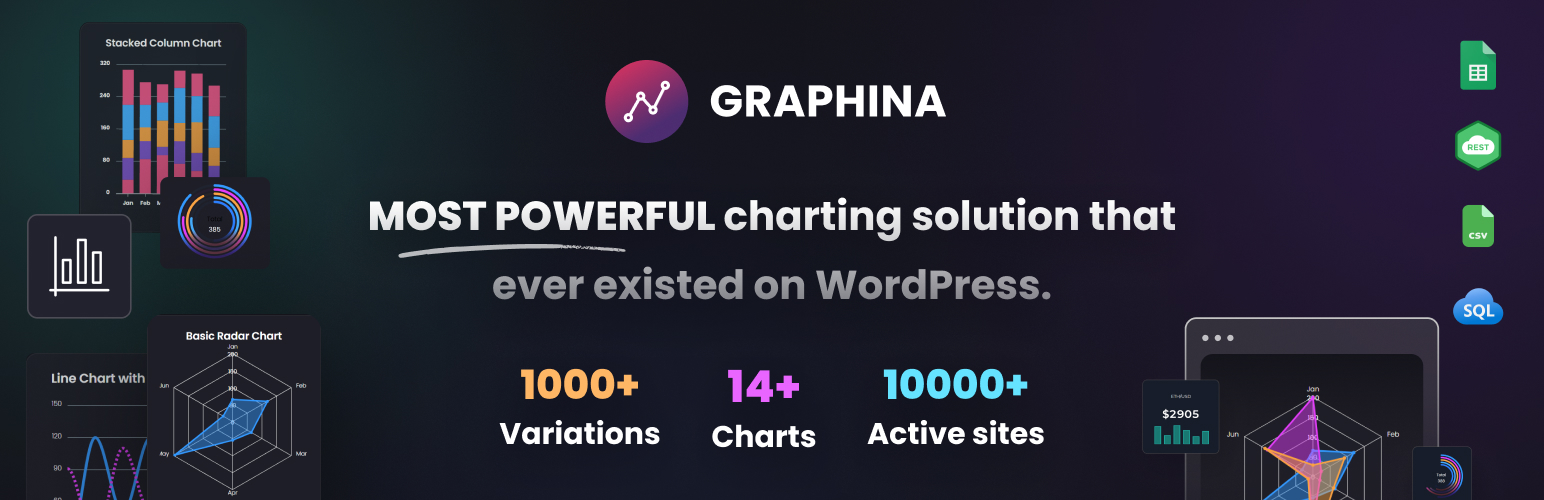
This plugin also lets you create WP Charts and Graphs more enjoyably. You can effectively implement data visualization in your WP site. It is a versatile WordPress Data Visualization plugin that works extremely well with Elementor sites. Furthermore, the plugin lets you build over 14 graphs and charts with thousands of variations. Besides, Graphina is based on Apex charts and offers many options, charts, and adaptability. It also includes AJAX data loading to speed up your site. Graphinas splendid features are Custom Color for Charts, Multiple Chart Legend Positioning, Chart datalabel Settings, XY Axis settings, Marker Style Settings, Chart Drop Shadow Settings, Series Value in Legend, Large String in Categories, Chart Admin Setting Page, real-time change chart type for same data, and more.
5. Ninja Charts

In the Ninja Charts plugin, you will get Easy-to-use UI, Design and Layout customization, Shortcodes to embed, Live preview on admin, Multiple chart types, Multiple data sources, Versatile rendering engines, Special formatting and preview option, and more completely free of cost. Furthermore, Ninja Charts is a robust data visualization plugin for making various interactive and customizable charts and graphs. To use the plugin, you have to select the titles and the chart type; after that, manually put a value in the popup box. After finishing the process, Ninja Charts will automatically render a shortcode for a single chart. You can embed this shortcode on any page or post to display the data.
6. AI Infographic Maker

The AI Infographic Maker is a tool that enables users to create infographics and elegant lists with ease. It utilizes OpenAI to generate content, making it possible for users to create impressive listicles quickly and efficiently. This plugin allows users to create free AI infographics from their WordPress backend with the help of ChatGPT AI. The tool makes data visualization easy, allowing users to build dynamic, HTML, and responsive infographics, as well as elegant text and image lists that come with embedded HTML5 charts and graphs. Users can display their infographics on any WordPress page or post with a shortcode for elegant data visualization. Furthermore, AI Infographic Maker offers a new way to create, curate, and visualize useful content or listicles and display them with elegant designs. Users can create elegant text lists, image lists, or infographics that their audience will love, bookmark, embed, and share.
Conclusion:
A visual representation of data makes it considerably easier to identify trends and patterns, assisting in the interpretation of the data. Consider this: a vast sea of data, with numbers piled upon numbers, concealing a story waiting to be uncovered. How can this monolithic data be transformed into a clear picture that is easy to comprehend? That is why WordPress data visualization plugins are needed to assist in achieving this goal.