 My Account
 What is an Infographic and Why is it Important?
Infographics have become an excellent medium for communication in almost every field. They offer a captivating way to convey complex data or information to targeted audiences. Those who are in the web or graphics design field may already know what an infographic is, especially if they’ve worked with free WordPress themes for graphic designers that highlight visual storytelling. But many people still do not know about them, even though they have been here for decades. If you are one of these people, don’t worry, this post has got you all covered. We show you the infographic’s meaning, its examples, and how you can create one yourself. So, let’s get started-
What is an Infographic?
We can describe an infographic as a way to visually represent data or information. This data effectively merges visual elements like photos, graphics, text, and graphs. By doing so, it lets you present complex things in a format that is easily understood.
Besides, infographics can serve as visual tools that communicate data by integrating various types of visual components to explain convoluted concepts. They briefly summarize data, outline processes, and show relationships to engage the audience effectively — much like the impact of community apps on local engagement or websites groups, which simplify interaction and make information more accessible.
Infographics have been adapted for mass communication purposes in recent years. As a result, we saw designs that need fewer assumptions regarding the readers’ existing knowledge. Infographics are accessible to everyone to enhance their utility as a means of conveying information.
Types of Infographics and Their Use Case
Infographics come in various types, and each of them presents certain content in an engaging and easily understandable way. Here are the popular types of infographics and their use case-
- Geographic Infographics
- Statistical Infographics
- Informational Infographics
- Flowchart Infographics
- Hierarchical Infographics
- Timeline Infographics
- Comparison Infographics
- Process Infographics
- List Infographics
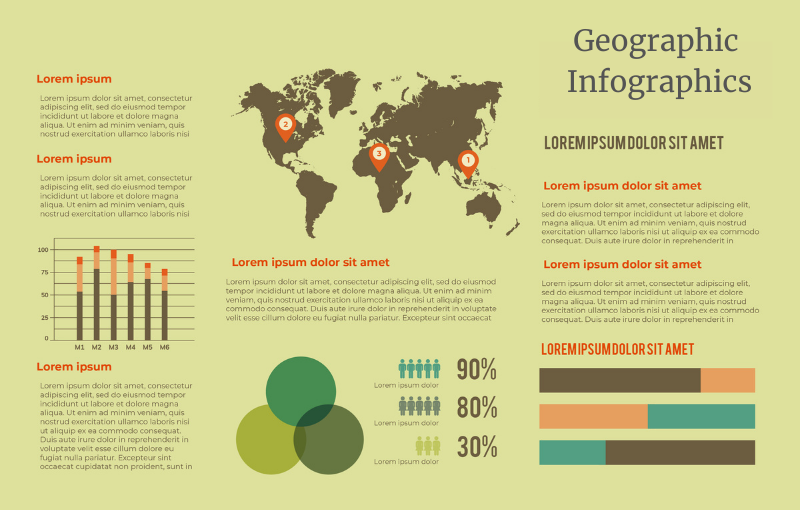
Geographic Infographics
Geographic infographics represent data using maps, charts, and other elements for easy understanding and analysis of complex geographic information. They generally convey information about places and their characteristics, like population distribution, climate change, etc.
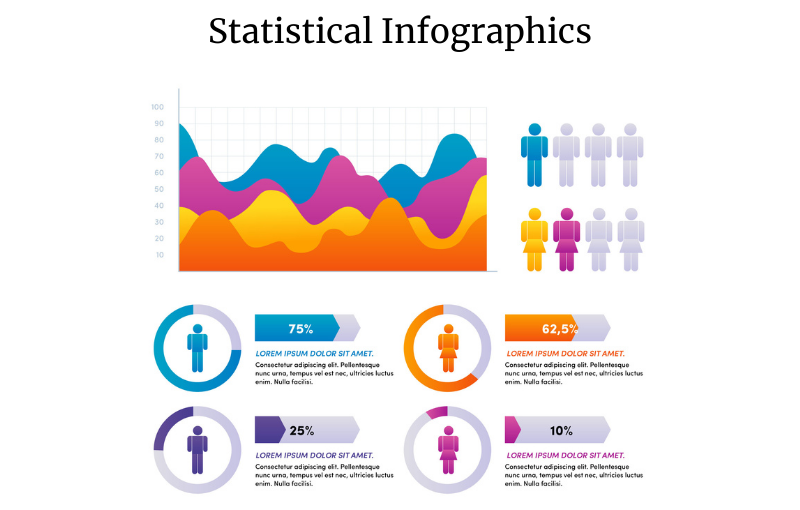
Statistical Infographics
Statistical infographics show data and statistics using charts, graphs, and other visuals. They are particularly useful for sharing survey results, presenting data from reports, or highlighting key statistics in the content, especially when paired with a guide to content marketing for WordPress websites to maximize reach and engagement.
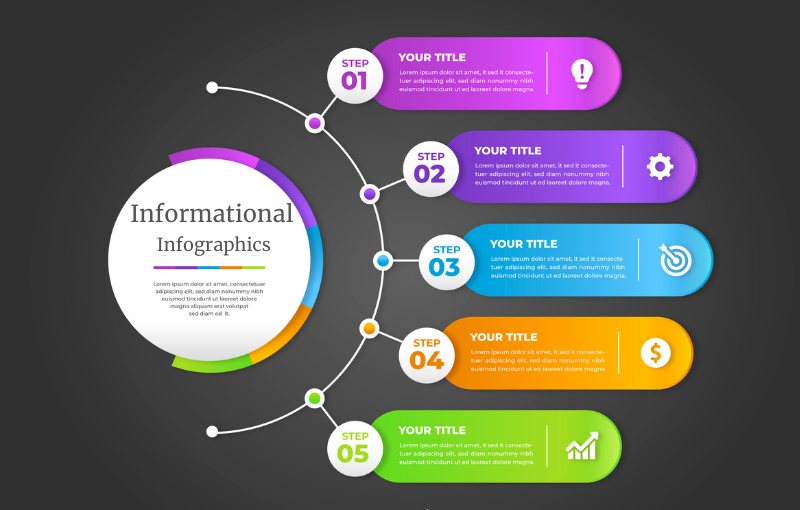
Informational Infographics
They visually illustrate information to explain complex topics in a clear and concise way. They use a combination of text, visuals like charts and icons, and layouts to break down information to make it easier to digest.
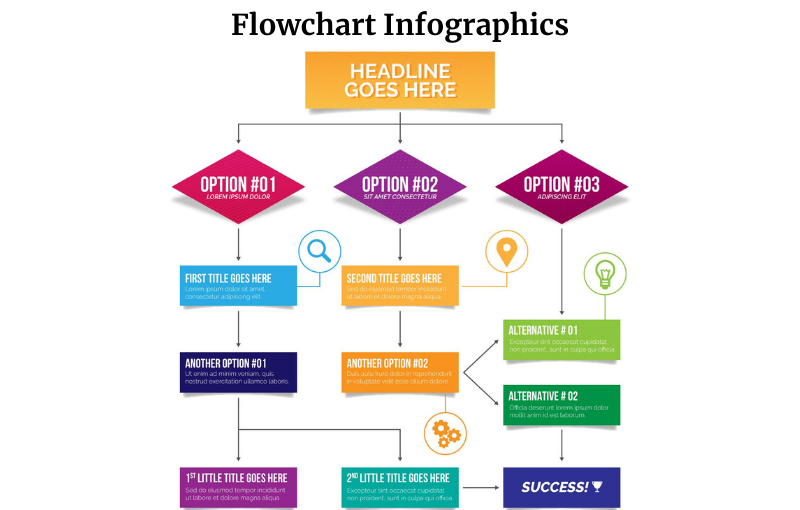
Flowchart Infographics
A flowchart infographic combines images, text, arrowheads, and other symbols to show all the involved steps in a process. These infographics are used in various fields such as CS, project management, and process analysis, and pairing them with free WordPress image optimization plugins ensures that visuals load quickly without compromising quality.
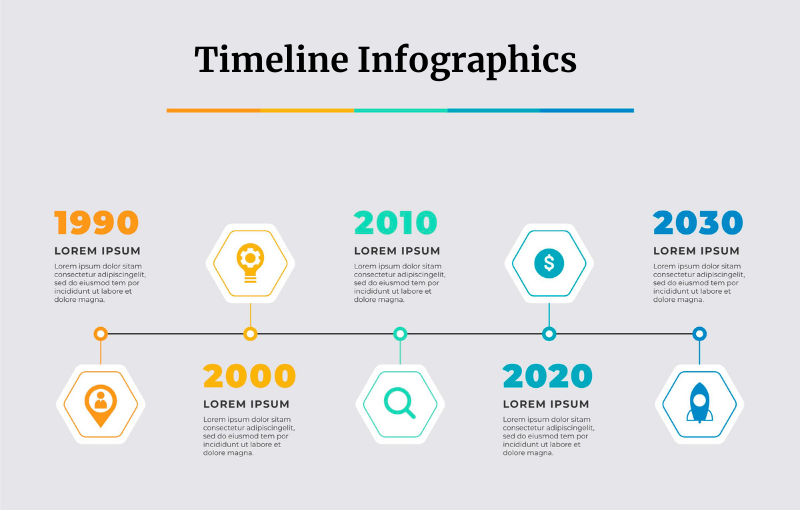
Timeline Infographics
It shows information or events in a time-progressive or chronological order. It is a very popular infographic in data presentations. Timeline infographics can be a simple list of dates and events or a more complex diagram showing the relationship between different time periods. Examples of timeline infographics are historical timelines, project timelines, a daily schedule, etc.
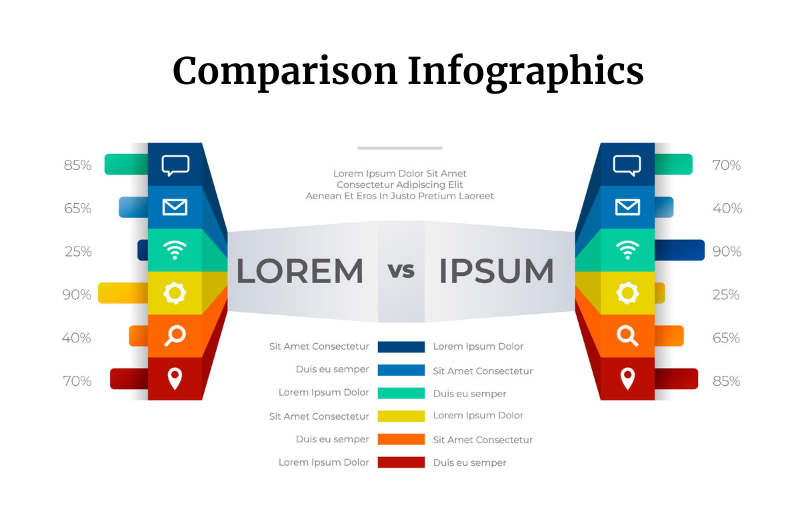
Comparison Infographics
As you can guess, this type of infographic is used to showcase the resemblances and differences between 2 or more objects. Comparison infographic uses graph charts or other design elements to visually represent the differences and likenesses.
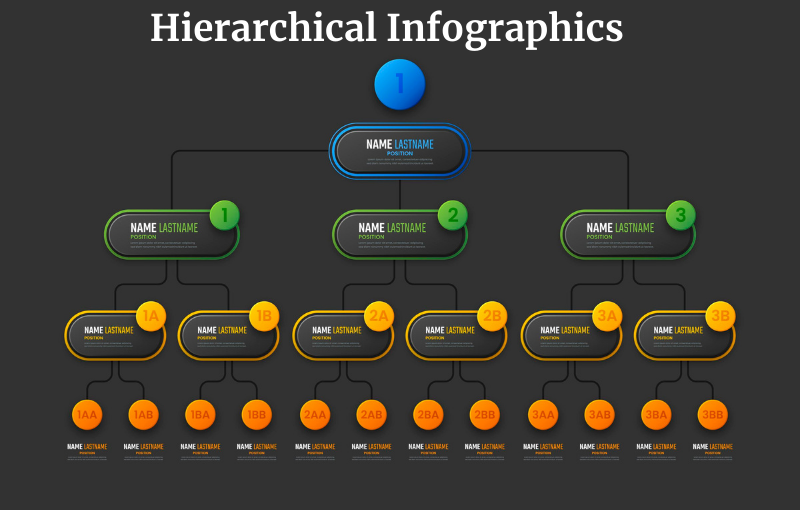
Hierarchical Infographics
You can use hierarchical infographics to visually represent data in layers or levels of importance. It often shows relationships between elements from top to bottom or vice versa. They are useful for displaying organizational structures and ranking information.
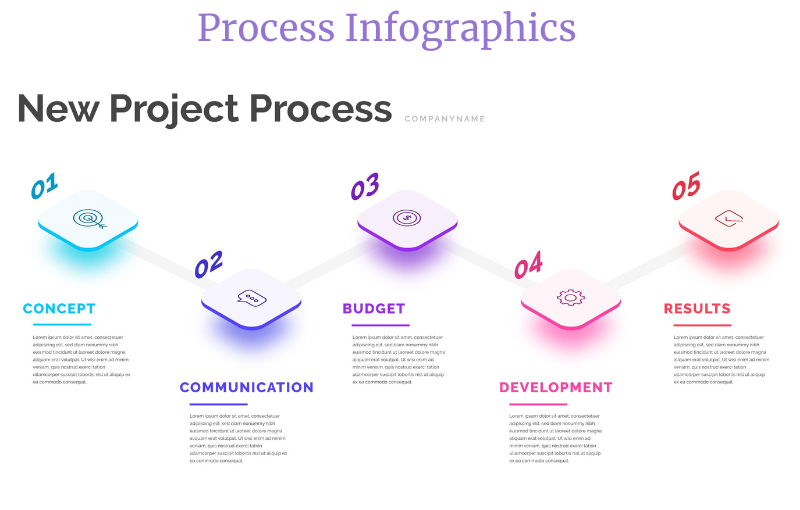
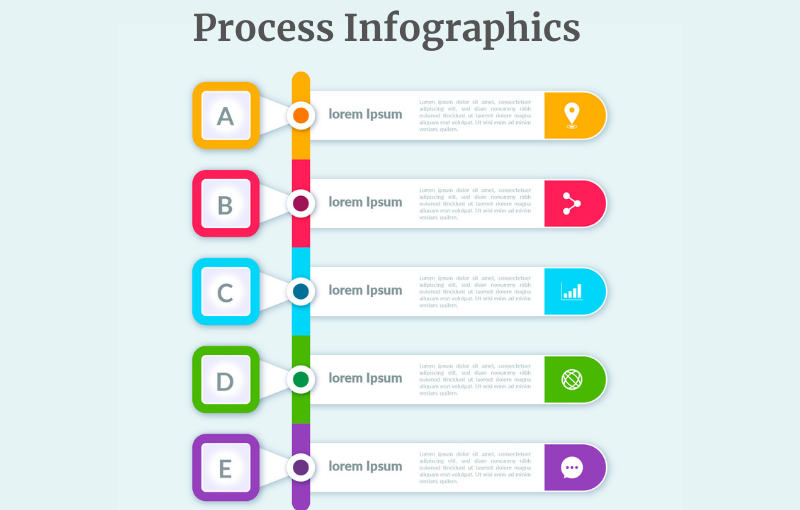
Process Infographics
Process Infographics shows a summary of the steps in a process. They are used for product guides, recipes, work operations, etc. A process infographic generally contains flowcharts, numbered icons, diagrams, and arrowheads to guide readers through steps in a process.
List Infographics
It can be categorized as an informational graphic that uses a written list to share information. You can easily find a list infographic in blog posts that includes a list of resources, examples, or tips. It uses creative fonts, radiant colors, and icons instead of bullet points to highlight each item.
Why Infographics are Important?
Infographics are valuable for lots of reasons, like they effectively express complex information and enhance content memorability. It improves readers’ understanding by combining visuals and text. Here are more reasons to use infographics-
Better Communication and Understanding
The best thing about infographics is that they break complex details into easily understandable visuals or graphical content. This content is processed faster by the brain than text. Thus, your audience can grasp key concepts and retain and recall this information easily. Infographics can also illustrate processes, compare data, and show relationships more effectively and easily than text alone can.
Increase Engagement and Easy Shareability
Infographics are naturally more visually appealing than text-heavy content as they contain visuals. Right! Also, their straightforward and engaging format makes them more likely to be shared on social media. Therefore, infographics can capture audience attention as well as increase content reach and brand visibility.
Versatile Use
We know infographics can be an appealing way for data visualization, trend highlighting, and statistics presentation. They also effectively illustrate steps in a process for users to understand it easily. Besides this, infographics can also be used for educational purposes, brand messages, promoting products, and building brand awareness. Thus, they have versatile uses in almost every sector.
Helps in SEO and Website Traffic
For website users, infographics can attract backlinks from other sites and get them more traffic to their site by making content more shareable and discoverable. This way, infographics can step up a site’s search engine ranking and make the overall user experience on the site satisfying through graphically interesting content.
An infographic presentation gives you a unique and effective way to convey information, draw audience attention, and improve overall content engagement. All this makes infographics important not only for individuals but for businesses as well.
How To Design An Infographic?
Creating your own custom infographics not only saves you money but also gives you the freedom to personalize them to fit your vision as a person or business. However, as an infographic creator, I know designing a captivating infographic can be tough, mainly for beginners. Many professionals use a readymade template as a base for their infographics, then customize them according to need. You can also use a template or start from zero for a completely original design.
Here, we are using a template to design an infographic. So, let’s get started with our infographic.
Step 1- Create an Outline for Your Infographic Design
You can start your process by creating an outline for your infographic design. It will help you review your ideas and content. Your outline must include the objective of your infographic, title, major headlines, and subheadings. Also, try to use as few words as possible to share your thoughts, and for any additional or outside details, add special notes.
Step 2- Choose an Infographic Template
Now, find a suitable infographic template for your project. Many websites offer pre-made infographic templates that you can use as a starting point for your infographic. These templates also give you design inspiration and creative ideas. Besides this, some tools even include AI design features that let you design all kinds of infographics without lifting a finger. For instance, reading a Genspark AI review can help you understand how AI-powered tools simplify the infographic creation process—just describe the type of infographic you want, and they will create it for you.
Step 3- Add Your Content to Customize the Infographic Template
After finding a suitable infographic template or AI-generated design, it is time for you to customize it. You can add content, then further customize it, like changing its colors, length, and font style. You can also add your custom text, charts, and other design elements to align it with your brand vision.
If you have hired an expert to design your infographics, you can add notes or special instructions for them. Like what color scheme, fonts, animation, or design elements to use, and tell them to add your text. You can also share infographic samples you like for reference. It will make their job easy and help them design the infographic you want.
Step 4- Save Your Infographic
When you are done with your customization and satisfied with the final design, it’s time to download and save it. Most platform lets you save it in popular PDF, HTML5, and image formats. You can also embed your designed infographics on your website or share them with a public or private link.
Tips for Designing Standout Infographics
Now you have seen various types of infographic examples and how to create them. Here are a few useful tips for designing standout infographics-
- Learn who your audience is and use design elements and colors that work for them.
- Try using different colors in your infographic design to draw attention to specific details or show information groupings.
- Make your infographic design as original and creative as possible. It will help you in SEO and stand out from the crowd.
- Make use of various icons, symbols, and illustrations to highlight the key information.
- Use a precise visual hierarchy to make your infographic design look cleaner, more inviting, and more professional.
Conclusion:
Infographics, no doubt, help you provide a brief overview of topics while presenting data in an easily understandable way. Knowing about the different infographic types can help you find the best fit for your project. If you don’t find any, you know how to create one by yourself now. Right! So, what’s the holdup? Design your own infographics now.